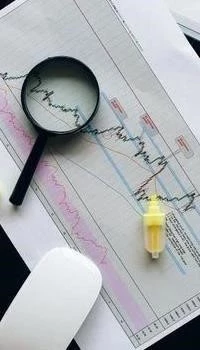
The relentless pace and intricate nature of financial markets demand a sophisticated approach to trading today․ The convergence of technical analysis with advanced automated trading systems has revolutionized how market participants identify opportunities and execute trades․ By systematically embedding market indicators into streamlined workflow automation processes‚ traders and institutions can transcend manual limitations‚ enabling the precise and unemotional execution of complex algorithmic strategies․
The Core: Technical Analysis‚ Indicators‚ and Algorithmic Strategies
Technical analysis serves as the bedrock‚ interpreting historical price and volume data to forecast future market movements․ It operates on the principle that market behavior often repeats‚ and current price action reflects all known information․ Within this framework‚ market indicators are indispensable tools․ These are mathematical transformations of price‚ volume‚ or open interest data designed to offer insights into market trends‚ momentum‚ volatility‚ and potential reversals․ Common examples include the Relative Strength Index (RSI) for momentum‚ Moving Average Convergence Divergence (MACD) for trend following‚ and Bollinger Bands for volatility measurement․ Each indicator is crafted to generate distinct‚ actionable trading signals – specific conditions that suggest a potential buy or sell opportunity․
The leap from manual interpretation to automated action is facilitated by automated trading․ This paradigm shifts trade execution from human discretion to computer programs operating under predefined rules․ At its heart are algorithmic strategies‚ which are sets of instructions that leverage market data‚ including indicator-generated signals‚ to make trading decisions and place orders․ Integrating technical indicators directly into these strategies is a fundamental component of modern quantitative finance‚ allowing for systematic‚ high-speed‚ and disciplined market engagement․
Architecting Automated Workflows for Indicator-Driven Trading
A robust automated workflow integrating technical indicators typically encompasses several interconnected stages:
Data Integration and Real-Time Data Acquisition
The bedrock of any effective automated system is timely and accurate data․ This necessitates robust data integration capabilities to aggregate diverse financial data feeds‚ including historical and crucial real-time data․ For strategies demanding immediate responses‚ such as high-frequency trading or intraday strategies‚ the latency and reliability of real-time data streams are paramount․ This continuous influx of data powers the subsequent stages‚ ensuring indicator calculations are always current․
Indicator Calculation and Trading Signal Generation
Upon receiving data‚ the automated workflow programmatically calculates the selected market indicators․ This often involves applying complex mathematical formulas to price and volume data․ The results are then analyzed against predefined thresholds or patterns to generate actionable trading signals․ For instance‚ a bullish signal might be triggered when the MACD line crosses above its signal line‚ combined with an RSI value indicating non-overbought conditions․ These signals form the direct input for strategy logic․
Strategy Definition and Rule-Based Logic
With signals in hand‚ the next critical step is to translate them into concrete algorithmic strategies․ This involves establishing precise‚ rule-based logic that dictates how the system should react to various trading signals․ Rules specify entry and exit points‚ position sizing‚ stop-loss levels‚ and take-profit targets․ The clarity and robustness of these rules are essential for predictable strategy execution․
Backtesting and Optimization: Validating Performance
Before any live deployment‚ rigorous evaluation is non-negotiable․ Backtesting involves simulating the algorithmic strategy against extensive historical data to assess its hypothetical performance across diverse market conditions․ This process yields vital metrics like cumulative profit‚ maximum drawdown‚ Sharpe ratio‚ and win rate․ Following successful backtesting‚ optimization techniques are applied․ This involves systematically adjusting indicator parameters (e․g․‚ period lengths for moving averages) and strategy rules to enhance performance․ However‚ extreme caution is exercised to prevent overfitting‚ where a strategy performs exceptionally well on historical data but fails in live trading due to being too tailored to past anomalies․
Strategy Execution via Trading Platforms
Once validated and optimized‚ the strategy is deployed for live strategy execution․ Modern trading platforms serve as the crucial link between the automated system and the financial exchanges․ These platforms provide APIs (Application Programming Interfaces) that allow algorithmic systems to seamlessly submit‚ modify‚ and cancel orders based on the generated signals and strategy rules․ Key features often include robust order management‚ real-time portfolio tracking‚ and integrated risk management tools․
Continuous Monitoring‚ Management‚ and Iteration
Automated trading is not a one-time setup; it requires continuous oversight․ Workflows must incorporate mechanisms for real-time monitoring of strategy performance‚ system health‚ and market conditions․ Alerting systems notify traders of unusual activity‚ while manual override capabilities provide crucial control․ The iterative nature of market dynamics necessitates ongoing review‚ refinement‚ and re-optimization of strategies based on new data and evolving market insights․
Advanced Techniques and Technologies in Quantitative Finance
The discipline of quantitative finance constantly pushes the boundaries of these workflows․ A transformative development is the integration of machine learning (ML)․ ML algorithms can:
- Uncover subtle‚ non-linear patterns in market data that traditional indicators might overlook․
- Adaptively adjust indicator parameters and strategy rules to changing market regimes‚ enhancing resilience․
- Generate more sophisticated and predictive trading signals‚ moving beyond simple thresholds․
- Optimize portfolio construction‚ risk allocation‚ and even develop entirely new predictive models for market behavior․
Furthermore‚ specialized workflow automation platforms and libraries provide sophisticated environments for designing‚ testing‚ and managing complex algorithmic trading systems‚ often offering modular components for data handling‚ signal processing‚ and execution management across various asset classes․
Challenges and Best Practices for Implementation
Despite their power‚ automated workflows integrating technical indicators present inherent challenges․ These include ensuring the absolute integrity and low latency of real-time data‚ mitigating execution risk and slippage‚ preventing overfitting during backtesting and optimization‚ and managing the computational overhead․ Best practices include:
- Rigorously validating data sources and implementing robust data integration pipelines․
- Diversifying strategies to avoid over-reliance on a single indicator or market condition․
- Implementing comprehensive risk management frameworks‚ including dynamic position sizing‚ stop-loss orders‚ and circuit breakers․
- Regularly stress-testing strategies against extreme market events․
- Maintaining vigilance through continuous monitoring and being prepared for manual intervention when necessary․
The seamless integration of technical indicators into automated trading workflows represents a cornerstone of modern financial market engagement․ By harnessing the power of algorithmic strategies‚ robust workflow automation‚ and the advanced computational capabilities of quantitative finance and machine learning‚ traders can systematically derive and act upon precise trading signals from market indicators․ This sophisticated approach‚ underpinned by meticulous backtesting‚ continuous optimization‚ and reliable strategy execution facilitated by cutting-edge trading platforms‚ not only dramatically boosts efficiency and mitigates human emotional biases but also unlocks unparalleled opportunities for disciplined‚ data-driven participation in the global financial arena․ The continuous evolution of real-time data acquisition and data integration techniques further solidifies this paradigm as the future of intelligent trading․



I found this piece incredibly valuable for understanding the evolution of trading. The emphasis on transcending manual limitations through systematic workflow automation and unemotional execution of complex strategies is spot on. It perfectly captures why algorithmic trading, powered by solid technical analysis, is the future.
This article brilliantly articulates the synergy between traditional technical analysis and cutting-edge automated trading. The explanation of how indicators like RSI and MACD are seamlessly integrated into algorithmic strategies provides such clear insight into modern financial market operations. Truly insightful and well-described!